Two scopes are available, the Autoscope III and the Autoscope IV. Both scopes have the same specifications.
The Autoscope IV uses custom 3 pin connectors to provide power to the end of the test lead to power various accessories. Adapters are available to allow BNC and banana connector style leads and accessories. To power accessories the scope needs to have the 4 pin power supply cable hooked up to a power source, such as the vehicle’s battery. Ignition system testing capabilities are built in to the scope.
The Autoscope III uses BNC connectors. Powering accessories is achieved by specific BNC test leads that have alligator clips for hooking up to a power source, such as the vehicle’s battery. Ignition system testing capabilities are achieved with an add on device.
General
| Parameter | Value |
|---|---|
| PC interface type | USB 2.0 480 Mbit/s (HI SPEED) |
| Maximum (supported from the device side) data transfer speed | 25 MB/s |
| Data FIFO buffer depth | 512 kB |
| Oscilloscope supply source | from USB |
| Current consumption from USB | |
| in operating mode: | no more than 300 mA |
| at idle: | no more than 60 mA |
| Current consumption of the “12V” input | no more than 1 A |
| Device provides uninterrupted (frameless) data transfer of digitized data to the laptop or PC. | |
| The stream of digitized data is stored directly on the hard disk of the laptop or PC in real time. | |
Analog oscilloscope
| Parameter | Value |
|---|---|
| Number of analog inputs | 8 |
| Voltage range (switchable, two ranges) | |
| analog inputs 1…4 | ±6 / 30 V |
| analog inputs 5, 6 | ±60 / 300 V |
| analog inputs 7, 8 | ±6 V |
| Input impedance | 1 MΩ |
| ADC resolution | 12 bit |
| Oversampling ADC resolution | up to 16 bits |
| Maximum sampling frequency for channel | |
| in 1 channel sub mode | 12.5 MHz |
| in 2 channel sub mode | 5.0 MHz |
| in 4 channel sub mode | 2.5 MHz |
| in 8 channel sub mode | 1.25 MHz |
| The nominal signal digitizing depth is 12 bit, increasing up to 16 bit with slower digitizing speeds. | |
Parameters of USB port galvanic isolation
| Parameter | Value |
|---|---|
| USB Autoscope IV has galvanic isolation of the USB port (device inputs ground <> PC ground) | |
| Galvanic isolation resistance | not less than 20 GΩ |
| Galvanic isolation capacitance | no more than 30 pF |
| Galvanic isolation test voltage | 2 kV for 1 minute |
Minimum Laptop or PC requirements
| Parameter | Value |
|---|---|
| Processor | Pentium IV - 2 GHz |
| Hard disk drive | 10 Gb |
| PC interface | USB2.0 480 Mbit/s (HI-SPEED) |
| Operating system | Windows XP SP2 / SP3, Windows Vista, Windows 7 or Windows 8 / Windows 8.1 |
| Additional requirements | Any reasonably modern laptop or PC will be adequate |
Purpose
The main purpose of the software and hardware that comprises the USB Autoscope system is troubleshooting of various electronic vehicle systems, such as ignition and timing system. The USB Autoscope is also very useful for engine mechanical diagnostics. The system is universal in nature and not tied to any particular vehicle system or brand. The usefulness of the system is not limited to just vehicles, but can also be used in the service and diagnosis of electrical machinery, other electrical devices, and electronic circuits and components.
The main modes
The USB Autoscope can be run in an analog oscilloscope or in a logic analyzer mode using the menu item “Start device”. The analog mode provides on‑screen display of the waveforms, but, compared with the logic analyzer mode, has a lower sampling rate. The logic analyzer mode provides a higher sampling rate of the signal and the output file waveform is also smaller, but its application is limited to only digital (two‑level) circuits.
It may be advantageous to have the device start in a preset mode. To do so, the desired mode can be saved using the menu “Control => Save mode”. In addition, the user can use already preset modes.

The menu item “Modes” makes it possible to use ready preset modes of the device as well as modes created by the user itself.
The available list of preset modes depends on which components were selected
during installation.
- Analog oscilloscope mode
Designed for displaying and recording voltage waveforms in circuits of sensors and actuators
of electrical and mechanical systems of the car.

Example of the waveforms recorded in analog oscilloscope mode.
Allows to find faults in the high and low voltage circuits of ignition systems, malfunction of sensors and actuators of engine control systems, power circuits, generator, starter, battery, mechanical problems with the engine. Using appropriate sensors makes it possible to see the vacuum waveforms from intake manifolds, pressure in the cylinders, changes of pressure in the fuel rail of diesel engines, current of fuel injectors power control circuits, the current in the battery / starter circuits. A diagnosis as to the state of health of a particular circuit or component can be done by comparing the displayed waveforms / graphs to known good waveforms or the built in tools for automatic analysis can be used.
The analog oscilloscope mode can be started using the menu “Modes” or “Start device”.
- Logic analyzer mode
Designed to monitor and record digital (two‑level) signals using the input connector “Digital Inputs”[1].

Example of the waveforms recorded in the logic analyzer mode.
In this mode are shown only two levels, corresponding to the presence or absence of active signal in the circuit.
Logic analyzermodeis called from the menu Start device => Mode select => Logic analyzer mode”, which will be available if during the program setup process the”Logic analyzer mode” component was selected.
PlugIns
PlugIns are software plugins that may be used in the analog oscilloscope mode while displaying and analyzing waveforms from an analog input. They improve the visibility of displayed waveforms and can automatically perform analysis in real time. If necessary, the user can use provided documentation and tools to make their own PlugIns. Detailed information and examples can be found in the document “PluginsScriptPlugin.chm”, which is installed in the program folder USB Oscilloscope, if during installation process components “Help files” and “Analyzer script / Panel Editor” were selected. For writing and debugging panel code it is recommended to use the editor “ScriptEditor.exe”, which is installed in the same folder.
- PlugIn “Ignition diagnostic”
Intended to diagnose ignition systems using the voltage waveform in the secondary circuit. Displays voltage waveform in the high voltage circuit of the ignition system. The waveforms are displayed as “Parade” or “Raster”.
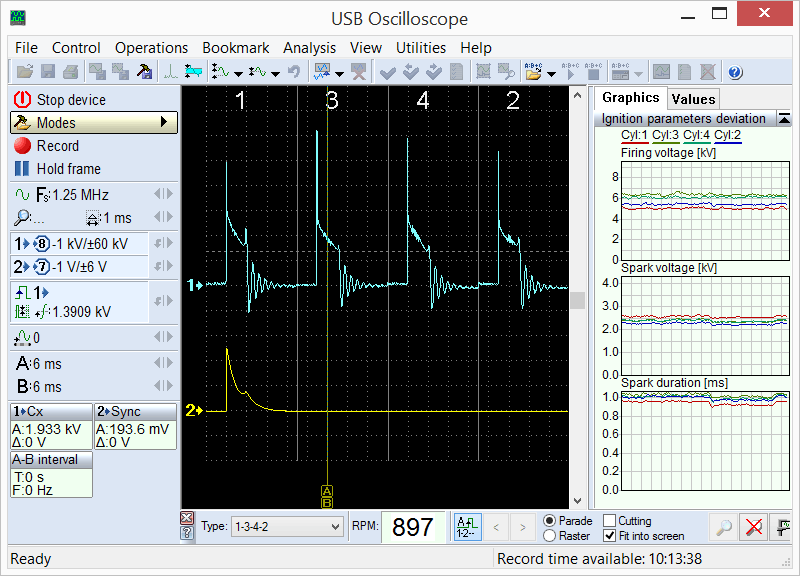
PlugIn “Ignition diagnostic”, mode “Ignition_Parade”.
Called from menu “Modes => Ignition => Ignition_Parade”.
In the “Ignition Parade” mode it is easy to discern voltage (amplitude) differences as differences in height of the voltage spikes. The “Raster” mode is best used to discern time differences such as spark burn time.

PlugIn “Ignition Diagnostic”, mode “Raster”.
Called from menu “Modes => Ignition => Ignition_Raster”.
This PlugIn also calculates and displays the firing voltage, the spark voltage and the spark duration for each of the cylinders in the form of graphs or columns.
- PlugIn “Phase measurement”
This PlugIn is designed to test the engine mechanical timing and to measure the ignition timing using the pressure graph without combustion. Points out the allowable ranges of characteristic points and plots a graph of pressure vs. Crank angle. The actual position of the characteristic points depends on the relative position of the crank and camshaft.
By comparing the actual position of the characteristic points of the graph with the allowable range it is possible to determine if the relative position of the crankshaft and camshaft
are correct.
The PlugIn also displays the current value of ignition dwell angle relatively to the peak pressure in the cylinder. Because the software does not rely on existing timing marks to determine ignition timing, no errors due to inaccurate or missing marks will be introduced. In fact,
the software can be used to gauge the relative accuracy of existing marks.
The PlugIn can be used to determine time or angle relationship between any pulsed signals, such as injection events for Diesel and gasoline engines and the relative position of the crankshaft.
The PlugIn is called from the menu “Modes => Px => Px / Px+Longer” for Px transducer or “Modes => Px => Px35″ / Px35+Longer” for Px35 transducer.
- PlugIn “Time parameters”
Depending on the selected measurements mode, calculates and displays the current duty cycle and frequency of a periodic signal, or pulse width.

PlugIn “Time parameters”, mode “Pulse Width”.
Selected using the menu “Modes => Injector”.
In the mode “Pulse width” for example, the pulse parameters of the fuel injector can be measured.

PlugIn “Time parameters”, mode “Frequency, duty cycle”.
Selected using the menu “Control => Time parameters”.
In the mode “Frequency, duty cycle”, PlugIn displays the current duty cycle and pulse frequency. This can be useful in the analysis of signals with a pulse width modulation (PWM),which are found in some actuators control circuits, as well as some sensors with two‑level output signal.
The measured values can also be viewed as graphs.
- PlugIn “Synchronize all channels”
Designed to work with time‑spaced signals from different channels of the oscilloscope, for example, to view the injector waveforms of the gasoline injectors.

In modern engine control systems, the injectors are usually fired or controlled sequentially, in the firing order. For this reason, comparing the waveform from one injector to another can be difficult.
The PlugIn displays the waveforms from the different channels in a raster format that makes it simple to compare their shape and duration.
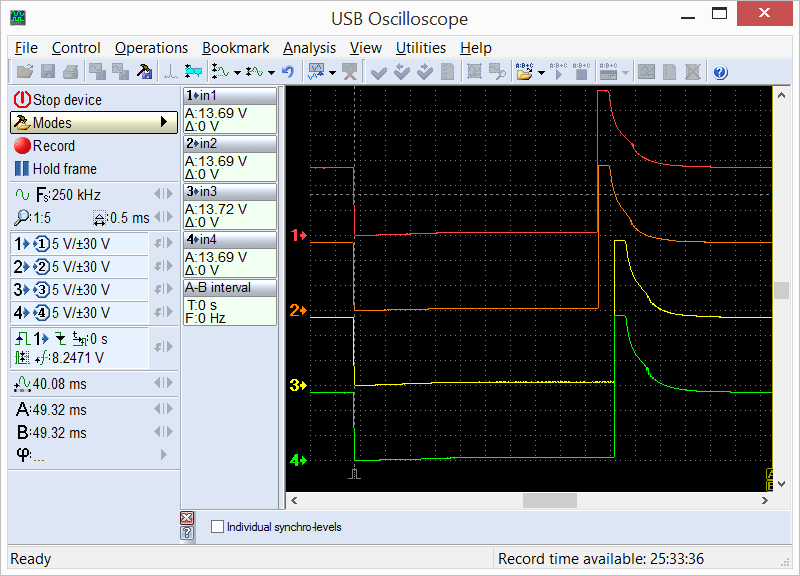
The PlugIn “Synchronize all channels” shows the time‑spaced pulses lined up vertically so that they may be visually compared.
This mode may be useful in a number of scenarios. For example, to compare the waveform from the cam and the crank sensor to each other. This will work even if the time difference varies such as with variable valve timing.
PlugIn is called from the menu “Control => Synchronize all channels” when using the oscilloscope in 2 or 4 channel analog mode. Synchronization must be activated and, if necessary, set up manually using the sync settings panel.
[1] USB Autoscope will be equipped with “Digital Inputs” connector according to the user request.
Analyzer panels
The analyzer panels are designed to work with the recorded waveforms. The software allows you to perform automatic analysis of waveforms, to improve the visibility and usability of the waveforms, and to convert the waveform shape to an easier to interpret form such as a bar graph. If necessary, the user can use provided documentation and tools designed to make their own analyzer panels. Detailed information and examples can be found in the document “AnalyserScriptFilesscript_en.chm”, which is installed in the USB Oscilloscope program folder, if, during the installation process “Help files” and “Analyzer script / Panel Editor” were selected. For writing and debugging code panel is recommended to use the editor “ScriptEditor.exe”.
- Analyzer panel “Px_Panel”
Designed to analyze the recorded cylinder pressure graphs without combustion. The panel automatically detects deviations from normal graphics and marks them using pointers.

Results of the analysis of cylinder pressure graph using the panel Px_Panel. If the software detects anomalies in the shape and position of characteristic points and parts of the waveform, they are automatically marked using pointers.
The panel is called automatically when opened waveforms were recorded in mode “Modes => Px => Px / Px+Longer / Px35 / Px35+Longer”.
- Analyzer panel “Dx_Panel”
Helps display and analyze vacuum waveforms from the intake manifold of gasoline engines. Waveforms can also be captured from the intake manifold of Diesel engines, if they are equipped with a throttle plate (or an intake restriction is created). The software can use the Dx transducer with or without an additional amplifier, or another transducer, such as a FirstLook® can be utilized.

Vacuum pulsation graph in the intake manifold of idling gasoline engine, analyzed using the analyzer panel “Dx_Panel”.
The panel is called automatically under the condition that opened waveforms were recorded in mode “Dx => Dx_Run”.
- Analyzer panel “SoftwareFilter_Panel”
Performs the functions of software filtering for the recorded waveforms. The software supports several different filtering algorithms, such as LP (low pass), HP (high pass), and notch filtering.
The pass or reject frequency band can be selected from the panel. This function can be very useful if attempting to analyze a signal in the presence of noise. Examples include starter current with bad brushes or Oxygen sensor waveforms with superimposed ignition noise.
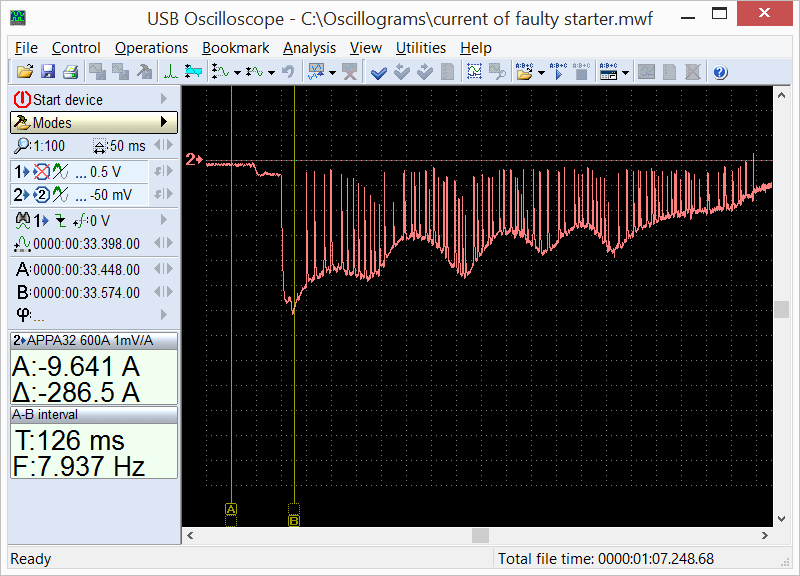
Current waveform from a starter having bad brush contact. The intermittent contact causes large noise spikes in the waveform, making it difficult to analyze relative compression, for example. By using a LP filter, the noise spikes can be removed and the waveform becomes much clearer.
By filtering out high frequency noise, the signal can be much easier to interpret.
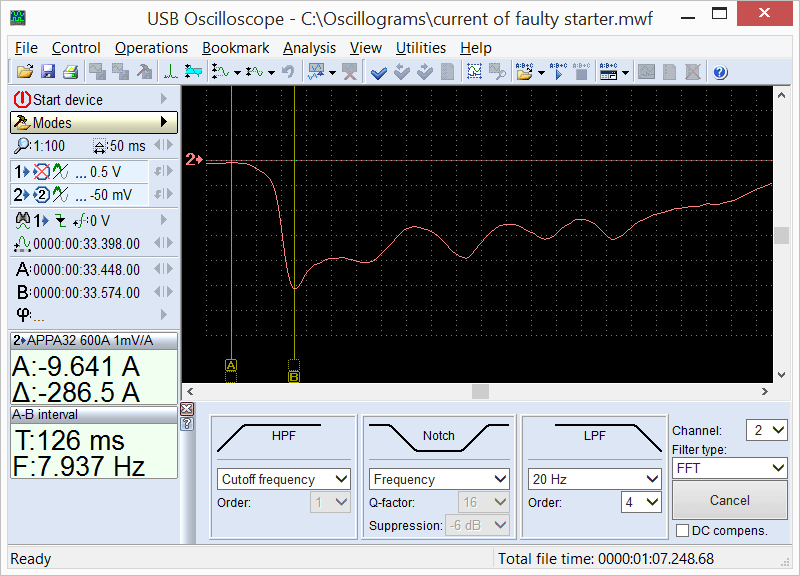
This is the same starter current, but LP filtered using the software.
The panel is called when viewing recorded waveforms using the menu “Analysis => Load analyser panel => SoftwareFilter_Panel => SoftwareFilter_Panel.apn”.
Analyzer scripts
The USB Oscilloscope software allows performing automatic analysis of recorded waveforms using algorithms stored in script analyzer files. The results of the analysis can be displayed in a text report, in graphical form, in the form of HTML report, or in the form of labeling source waveforms by text comments.
If desired, the user can use documentation and tools designed to create their own analyzer scripts. Detailed information and examples can be found in the document “AnalyserScriptFilesscript_en.chm”, which is installed in the program folder of USB Oscilloscope, if during the installation process were selected components “Help files” and “Analyzer script / Panel Editor”. For writing and debugging code is recommended to use the script editor “ScriptEditor.exe”, found in the program folder.
- “CSS” script
The CSS script, created by Andrew Shulgin, is designed to identify the causes of uneven engine cylinder efficiency by comparing the relative effectiveness during different engine operating modes. The script can determine exactly which cylinder is less efficient than the others and what type of problem the cylinder has. The script will determine if the problem is in the mechanical part of the engine, the fuel system or the ignition system. The “Efficiency” tab is the main tab of the script report.

The “Efficiency” tab of the CSS script report displays graphs of cylinder efficiency during different modes of engine operation. In this case, cylinder #1 under load experiences misfire due to a fault in the ignition system and cylinder #3 has lowered dynamic compression.
Also, the script is able to calculate characteristics of the toothed disc or reluctor as well as the crankshaft position sensor itself and provide the results of the analysis in a graphical form, as a polar diagram.

The “Toothed disk” tab from the script report CSS.
The black colored polar diagram, calculated automatically, visually displays the configuration of the toothed disk or reluctor, as well as the number and location of the teeth. It also shows the relative position of the disk and the crankshaft sensor when the piston of the cylinder #1 is in TDC at the end of the compression stroke before the beginning of the working stroke.
The red graph or polar diagram shows the deviation of the tooth pitch of the toothed disk or reluctor. This graph allows to estimate the accuracy of manufacturing as well as identify any damaged teeth (bent, missing).
The green colored graph displays the relative signal strength from the sensor as the reluctor or toothed disk rotates. The value depends on the gap between the sensor and the toothed disk, strength of the magnetic system, and the electrical winding of the sensor. The signal is compensated for engine speed, so is independent of the actual RPM of the engine. The graph allows to find the runout of the toothed disc, deflection of the crankshaft sensor sensitivity and incorrectly installed gap between the sensor and the disk.
In the “Ign. timing” tab script the diagram of ignition timing versus engine speed and load is shown.
To analysis using algorithm of CSS script click the menu “Analysis => Execute script” under condition that the waveforms were recorded in “CSS” mode.
- “Px” script
Created by Andrew Shulgin, the Px script is designed for in depth analysis of a recorded cylinder pressure graph. It analyzes the graph automatically and the analysis results are provided in text and graphical form.

In the Report of the Px script tab service information and diagnostic messages with a brief description of the identified deviations are displayed.
Any found errors are displayed in the Report tab in the form of text messages, as well as illustrated by the pointers in the appropriate graphic tabs.
The “Valve timing” diagram indicates the quantity of gas in the cylinder versus the crankshaft angle and makes valve timing checking easy and clear.

The “Valve timing” tab from the Px script displays the quantity of gas in the cylinder versus the crankshaft angle.
In the “Quantity” tab the same information is shown, but relative to the piston position and the stroke.

The “Quantity” tab from the Px script shows the quantity of gas in the cylinder relative to the piston position and stroke.
The Px script can also analyze the relative position of the peak cylinder pressure and synchronization signal from ignition spark. The script, based on this information, is able to display a diagram of the relationship between the ignition timing, engine RPM, and load.
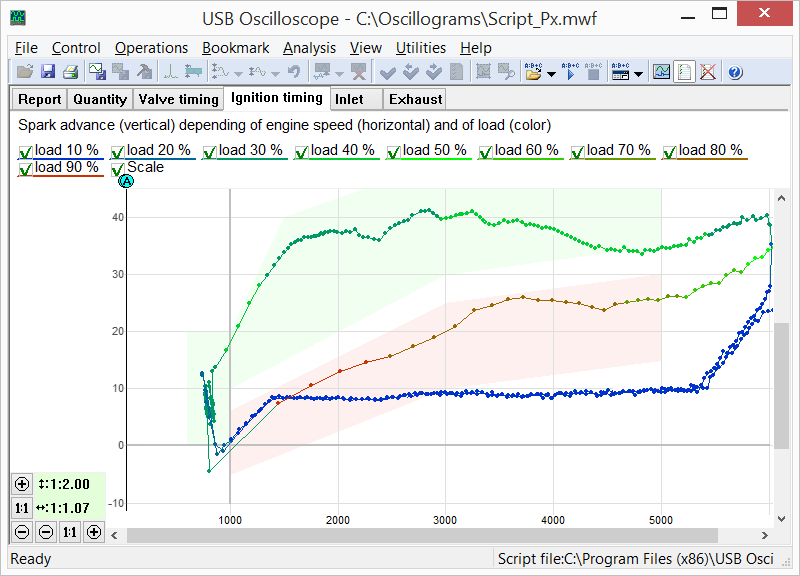
The “Ignition timing” tab from the Px script. The script displays the relationship between the ignition timing, engine RPM, and load.
The diagram will display abnormalities in the ignition timing vs. Engine RPM and load, not only during steady state conditions, but also during transient conditions, such as rapid throttle opening.
The Px script is also able to construct a diagram of cylinder filling (VE – Volumetric efficiency) on the intake stroke as it depends on the engine RPM and load.

The “Inlet” tab of the Px script. Shows a diagram of cylinder filling as it changes depending on engine RPM and load.
The red trace of the “Inlet” diagram displays the relationship between engine RPM and the amount of air filling the cylinder during the intake stroke at open throttle. The shape and location of this trace is affected by:
- Valve timing and lift;
- the number and diameter of the timing intake valves;
- operation of the system that changes the geometry of the intake manifold;
- flow area and a maximum throttle opening angle;
- the capacity of the air filter;
- configuration of the intake tract resonators;
- parameters of turbocharger and / or mechanical blower;
- the work of other cylinders of the engine.
This diagram makes it possible to determine what changes in the intake system design has on the volumetric efficiency of the engine at various RPM ranges.
Tuning of a single component of the intake system often affect the charging of the cylinder in a relatively narrow range of engine speeds. If the change causes an increase in cylinder fill at low engine speeds then the maximum torque range of the engine may be affected. If the change increases cylinder fill at high engine speeds, then maximum power output will be affected. If the red trace stays high and without significant dips, the torque band will be broad, assuring good driveability.
The last tab of the Px script displays characteristics of the exhaust system.
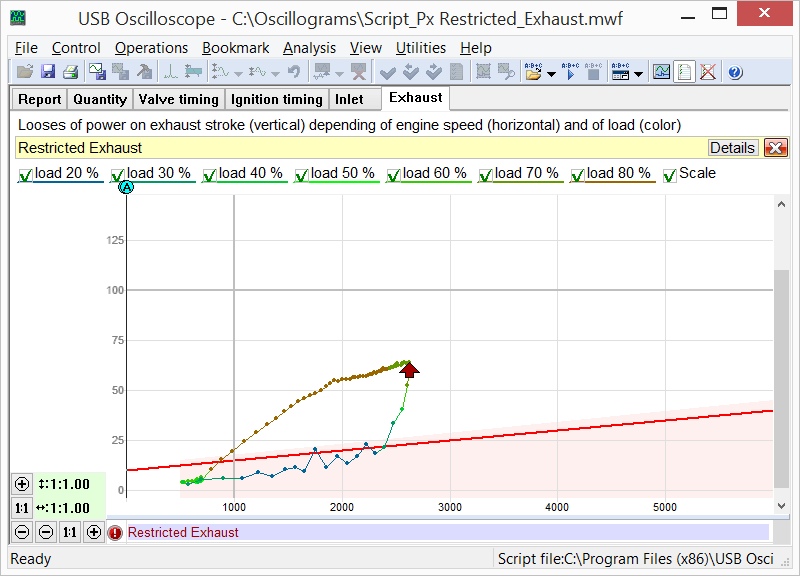
The “Exhaust” tab of the Px script. This tab displays the loss of power caused by scavenging the exhaust gases from the cylinder. The diagram is speed and load dependent, as are many of the dynamic tabs shown in these scripts.
The shape and location of the “Exhaust” diagram depends on the capacity of the exhaust system to scavenge exhaust gases, which is influenced by:
- The number and diameter of the exhaust valves;
- The exhaust valve lift and timing;
- The capacity and cross section of the catalytic converter, resonator and muffler;
- The parameters of the turbocharger (size, design);
- Resonance processes in the exhaust tract;
- etc.
In case of a critical deterioration of the exhaust pipe capacity, the script will print a diagnostic message. This can be very useful in finding partially plugged catalytic converters and other issues.
Analysis of Px script algorithm runs through the menu “Analysis => Execute script” if the cylinder pressure diagram was recorded in mode “Modes => Px => Px / Px+Longer / Px35 / Px35+Longer”.
- “ElPower” script
The ElPower script designed by Andrew Shulgin is used to obtain a comprehensive understanding of the condition of the engine starting and charging system. As a result of an analysis of the current graph produced using a current clamp, the script produces detailed information about the state of the battery, starter, alternator, as well as other high‑power electric vehicle consumers.
In the “Graphics” report tab, using the measured voltage and current graphs of the battery script, graphics of the generator output current and current of customers are computed. The computation allows in depth study of their characteristics and modes of operation.
Analysis using algorithm of ElPower script runs through the menu “Analysis => Execute script” if the opened waveform was recorded in the mode “ElPower”.
- “I2C” script
This script allows to analyze digital signals recorded from SCL and SDA lines of I2C serial interfaces.

I2C interface waveforms, recorded in the logic analyzer mode and marked by the analyzer script I2C.
The I2C script can be called in the waveforms view mode from folder with USB Oscilloscope program using the menu “Analysis => Open script => Digital_Interfaces => I2C.asc”. This menu is available, if during the installation process the component “Logic analyzer mode” was selected. Analysis runs through the menu “Analysis => Execute script” if the opened waveform was recorded in the logic analyzer mode. I2C interface signals should be recorded at the maximum available sample rate.
- “USB2″ script
This script allows to analyze digital signals recorded from D+ and D– lines of serial interface USB for low speed (1.5 Mbit/s) and full speed (12 Mbit/s) specifications. The USB2 script algorithm allows for identifying and partially understanding data packets transferred through an USB bus.

The configuration window on the background of the generated report during the analysis of USB bus waveforms.
Script provides information not only on every word transferred through USB packets, but also about data timing to the original signal.

USB bus waveform, marked by the USB2 script analyzer.
This allows to evaluate the processes not only at the protocol level, but also on the physical level, which simplifies the process of finding the causes of failure when debugging devices based on the USB bus.
The USB2 script can be called in waveforms view mode from the folder with USB Oscilloscope program using the menu “Analysis => Open script => Digital_Interfaces => USB2.asc”. This menu is available, if during the installation process the component “Logic analyzer mode” was selected. Analysis runs through the menu “Analysis => Execute script” under the condition that opened waveforms were recorded in the logic analyzer mode with a sampling rate of not less than 96 MHz.
- “UART” script
Allows to analyze digital and analog signals recorded from the RX and TX lines of an UART serial interface.

RS232 waveforms, marked by UART script analyzer.
The current version of the analyzer allows to analyze signals at speeds of no more than 115200 bit/s.
The UART script can be called in waveforms view mode from the folder with the program USB Oscilloscope using the menu “Analysis => Open script => Digital_Interfaces => UART.asc”. This menu is available, if the component “Logic analyzer mode” was selected during installation. The analysis runs through the menu “Analysis => Execute script”.
- “PS2″ script
This script allows you to analyze digital signals taken from the CLK and DATA lines of a PS/2 serial interface.

Marked by PS2 analyzer script waveforms.
The PS2 script can be called in waveforms view mode from the folder with USB Oscilloscope program using the menu “Analysis => Open script => Digital_Interfaces => PS2.asc”. This menu is available if the component “Logic analyzer mode” was selected during the installation process. The analysis runs through the menu “Analysis => Execute script” under the condition that in the window are opened waveforms recorded in the logic analyzer mode.
- “WaveExport” and “MWaveExport” scripts
These scripts are intended for exporting waveforms in an external text file format such as the Comma Separated Value (CSV) format. CSV files can be imported in to spread sheet programs, for example, as well as other third‑party software. The source code is open, so the output data format can be modified to suit.
The scripts can be called in waveforms view mode from the folder with USB Oscilloscope program using the menu “Analysis => Open script => WaveExport.ajs” or “Analysis => Open script => MWaveExport.ajs”. These menus are available if the component “Additional files and modules” was selected during the installation process. The exporting runs through the menu “Analysis => Execute script”.
While the USB Autoscope software has built in translation, there is nothing stopping a user from doing the translation themselves. Min/max features may be of assistance in some cases. The pressure transducers available also work with any other meter or lab scope. A meter can be used if absolute values are of interest in lieu of the actual waveform.
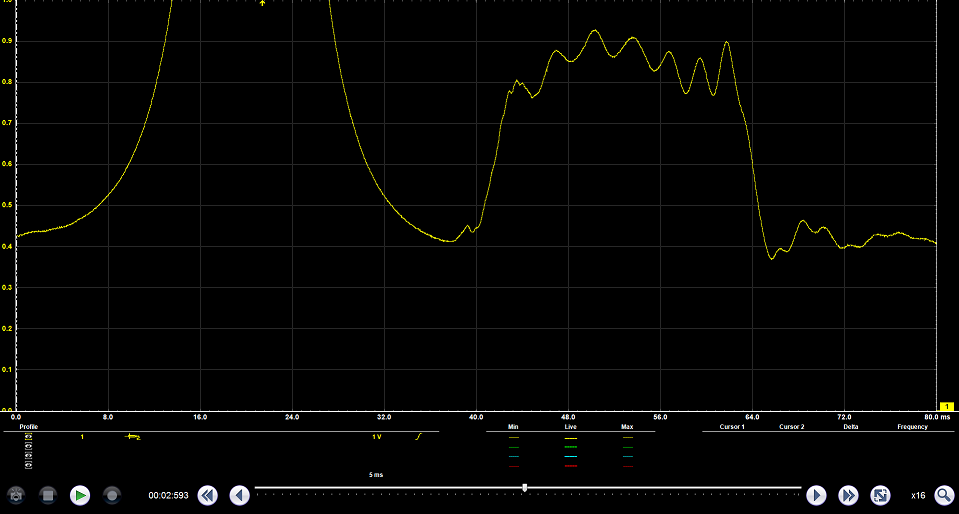
Example of the Dx being used on another brand of lab scope. The Dx was being used during cranking with AC coupling enabled to overcome this scope’s inflexible scaling.
Example of the Px being used on another brand of lab scope. The Px was being used with a Px Longer attachment. No filtering is being used.
While not every lab scope (or meter) has the advanced features of the USB Autoscope software, the transducers can still be used. The powered test leads are BNC connector based. If the scope or meter being used requires banana connections then an adapter will be necessary.


